How to Read Candlesticks in Trading: Analyzing Combinations
Japanese candlesticks are a key element of technical analysis that reflect the actual struggle between buyers and sellers over a selected time frame. Each candlestick that forms shows which side maintained control over the price by the time the time frame closed.
Understanding these underlying mechanics allows a trader to identify precise entry points and recognize when the current trend is losing momentum.
To analyze the performance of your account and keep systematic records of all your trades, use our online trader's journal.
Candlestick Anatomy: Body and Shadows
Each candle consists of two main elements, each of which conveys a specific signal:
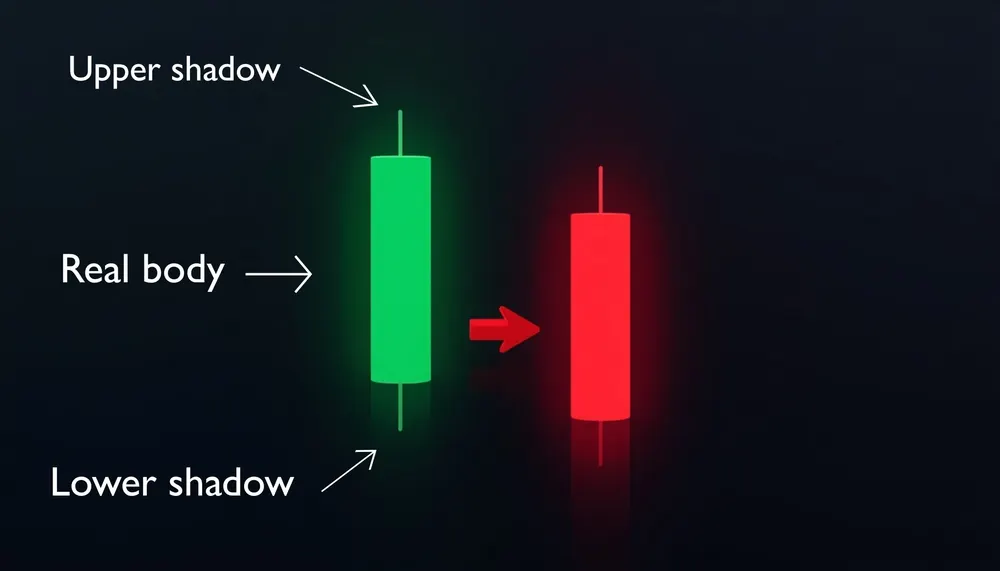 The Anatomy of a Japanese Candlestick: Body and Shadows on a Chart
- The candle body shows the final outcome of the trading session. If the body is green, buyers won the session; if it is red, sellers had the upper hand.
- Shadows (wicks) — indicate the highest and lowest prices reached during the price movement. A long upper shadow indicates that buyers tried to push the price higher, but sellers put up strong resistance and repelled the rally. A long lower shadow, on the other hand, indicates the strength of buyers who bought up the dip.
One of the most common mistakes made by beginners is trying to draw conclusions based on a single candlestick. The true picture of the market only becomes clear when analyzing a series of several consecutive candlesticks.
Interpreting Candlestick Patterns and Sequences
To understand how prices will move going forward, you need to learn how to connect individual candlesticks into a single logical sequence:
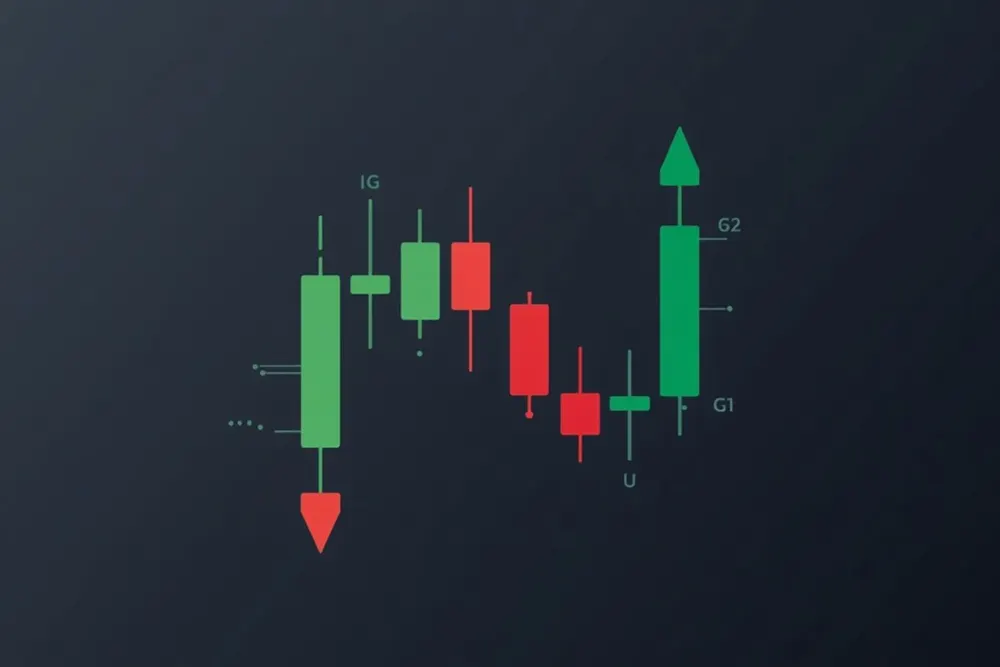 Candlestick Patterns and Sequences on Charts in Trading
- Building momentum: The appearance of three consecutive green candles with strong bodies confirms that buyers are in full control of the market and are driving the price higher on strong volume.
- Seller pressure: If a small candle with a short body forms next to a large red candle, this indicates that attempts at a pullback are weak. In such a situation, the downtrend is likely to continue.
A systematic approach to analyzing candlestick patterns helps you build profitable trading setups. To learn more about how reversals work after a series of candlesticks, we recommend studying how the breakout signal strategy performs on lower time frames.