Japanese candles and timeframe: search for entry points
Japanese candlesticks are one of the most informative tools for chart analysis. Unlike conventional lines, they show not just the direction of the price, but the real struggle between buyers and sellers. Understanding the candlestick structure and the right timeframe form the basis for confident and profitable trades.
How the Japanese Candle Works and What It Says
A conventional linear graph displays only closing points and masks important details. In contrast, the Japanese candle completely reveals the price path for a specific period of time. Each candle consists of two key elements:
- The body of a candle is a rectangular part that shows the range between the opening and closing price. The width and size of the body assess the main volume of movement.
- Shadow (wick or tail) - thin lines from above and below. They indicate the extremes (maximums and lows) that the price touched before the pullback.
Color logic and candle signals
The color and shape of the candlestick give a quick hint of market sentiment:
- Green candle – the price closed higher than it opened (predominantly buyers).
- Red candle - the price closed below the opening level (predominant sellers).
- A large body with short shadows - there is a confident, calm movement in one direction in the market.
- A small body with long shadows is a sign of a tough struggle between bulls and bears. In such moments, it is better to refrain from entering the trend and wait for stabilization.
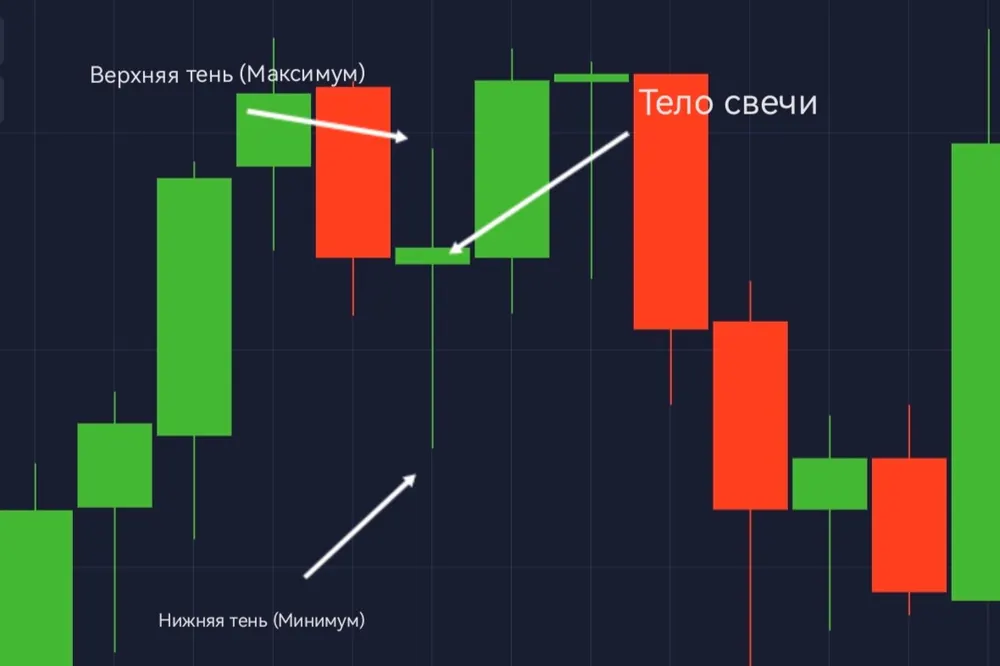 Японская свеча на графике
 What is a timeframe and how it works
A timeframe is a time period during which one candle is fully formed. Working with multiple timeframes simultaneously allows you to look at the market from different angles and see the full picture:
- The senior timeframe shows the general global trend direction and where the bulk of market participants are moving.
- Younger timeframe – reveals the “inside” of one large candle. It shows micro-levels, local stops, and precise entry points that are not visible on a large scale.
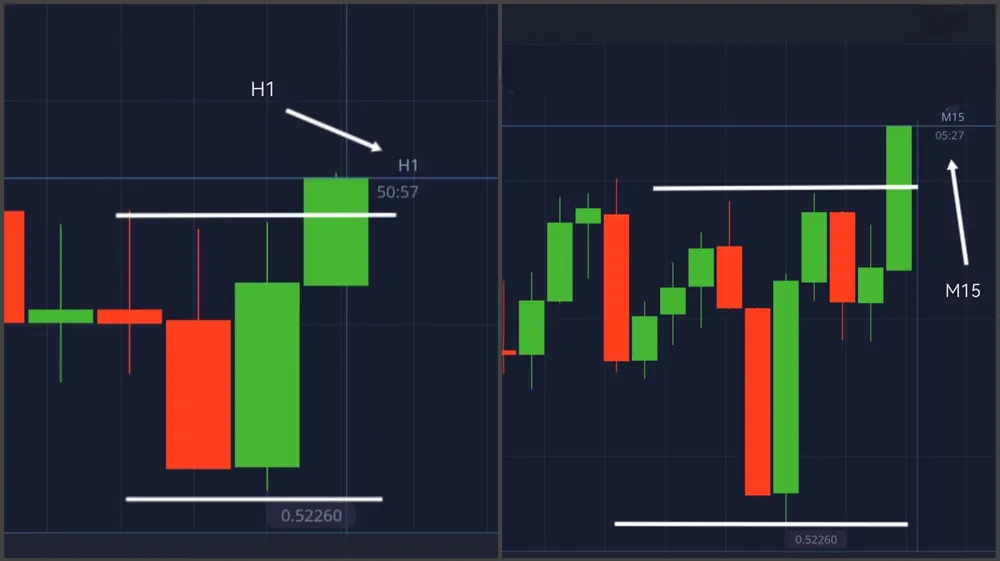 Схематичное сравнение двух графиков таймфрейма
Algorithm of decision-making on candle analysis
- Step 1. Trend definition. On the senior timeframe, evaluate the global direction and make a fundamental decision - buy or sell.
- Step 2. Find the entry point. Go to the junior timeframe, find local intermediate levels, and select the safest moment to enter.
- Step 3. Setting up the expiration. Select a comfortable transaction duration (expiration time), based on current activity and market volatility.