The "Breakout Signal" Strategy
In trading on short time frames, simple strategies often prove to be the most effective. The “Breakout Signal” strategy is based on identifying the moment when a local correction or a fading trend changes direction, and the Stochastic oscillator confirms the reversal from the extreme value zone. If you want to record all your entry points and track the strategy’s win rate in real time, our online trader’s journal can help you keep track of your statistics.
The Essence and Logic Behind the Strategy
The basic principle is to wait for the first candle of the new trend to form after an actual color change, but only when the indicator is in the extreme zone (overbought or oversold). To identify such patterns more accurately, it is important to correctly analyze Japanese candlesticks and the timeframe on the selected chart.
- Chart timeframe (TF): any usable timeframe (from 15 seconds to 5 minutes).
- Expiration time (for a trade): exactly equal to the duration of a single candlestick (for example, 1 minute on the M1 time frame).
- Indicator: Stochastic Oscillator (classic settings of 5-3-3 or 14-3-3).
Rules for Entering a Trade
Purchase (UP / CALL Transaction)
- Indicator Check: The Stochastic lines are in the oversold zone (below the 20 level) and are forming a bottom-to-top crossover (the fast line is crossing above the signal line).
- Waiting for a candlestick: The chart shows a series of red (bearish) candlesticks. We are waiting for the first green (bullish) candlestick to close.
- Market Entry: As soon as the green candle closes, open a UP trade in the first second of the new candle for a duration equal to the chart’s timeframe.
Sale (PUT Transaction)
- Indicator Check: The Stochastic lines are in the overbought zone (above the 80 level) and are forming a top-to-bottom crossover.
- Waiting for a candlestick: The chart shows a series of green (bullish) candlesticks. We are waiting for the first red (bearish) candlestick to close.
- Market Entry: Immediately after a red candle closes, at the very start of the new candle, open a DOWN trade for the duration of one candle.
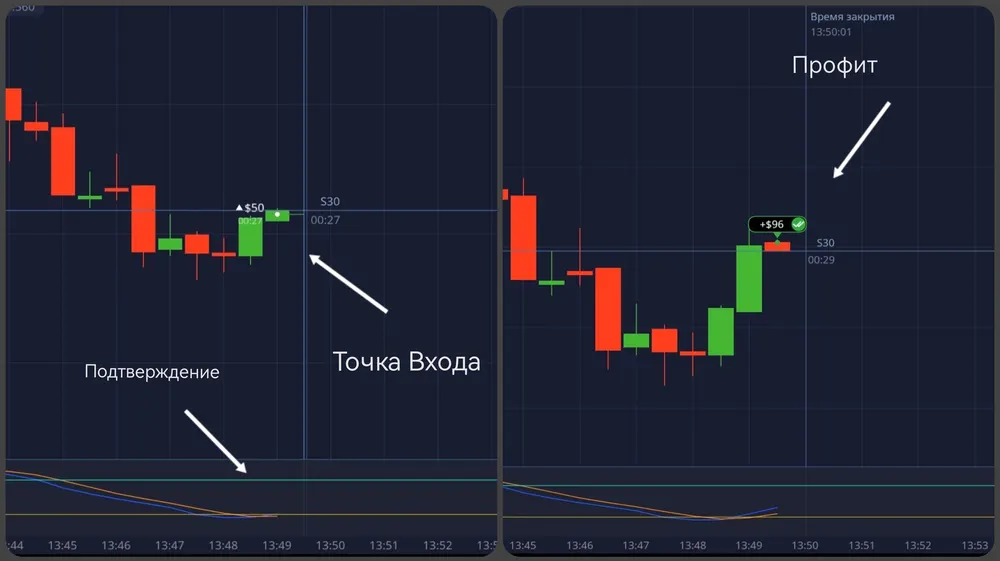 Entry Point and Profit
The main restriction: a ban on trading in the middle of the range
Even if the candle color changes on the chart, there is no clear dominance of sellers or buyers in the middle of the range. Entering the market at such points significantly lowers the win rate and turns the system into a guessing game.
Practical Tips and Insights for Traders
- The ideal entry timing: Open the trade exactly when the timer resets (in the first second of a new candle’s formation). A delay of even 2–3 seconds on lower time frames can cost you some of your profit.
- Flat-Channel Filtering: The “Breakout Signal” works best when identifying impulse rebounds from local levels or the completion of micro-corrections within flat channels.
- The Rule for a Losing Streak: If, after a color change, the first trade closes at a loss and the Stochastic is still in the extreme zone, do not increase your position size. Wait for the next clear color change.
- Signal Candle Size: Do not enter a trade if the color-change candle is abnormally large (news-driven spike). In such cases, the market often forms a wick or an immediate reversal correction.